

What RSI is
The Relative Strength Index, or RSI, is a momentum oscillator on a fixed 0 to 100 scale. J. Welles Wilder introduced it in 1978. Most platforms load a 14-period RSI. That length is a convention, the same way 12, 26, and 9 are the usual MACD settings. If you change the period, you are looking at a faster or slower version, so compare charts only when the setting matches.
RSI compares the size of recent up closes with the size of recent down closes. The common form is RSI = 100 − (100 / (1 + RS)), where RS is the average gain divided by the average loss over the lookback. A reading of 50 means those averages are about equal. Above 50, recent gains have been larger. Below 50, recent losses have been larger. RSI does not use volume, and the scale stops at 0 and 100.
The 30 and 70 bands
The usual reference lines are 30 and 70. A reading above 70 is often called overbought. A reading below 30 is often called oversold. On this scale those words mean the recent gain-and-loss balance is stretched. They describe the closes that already printed.
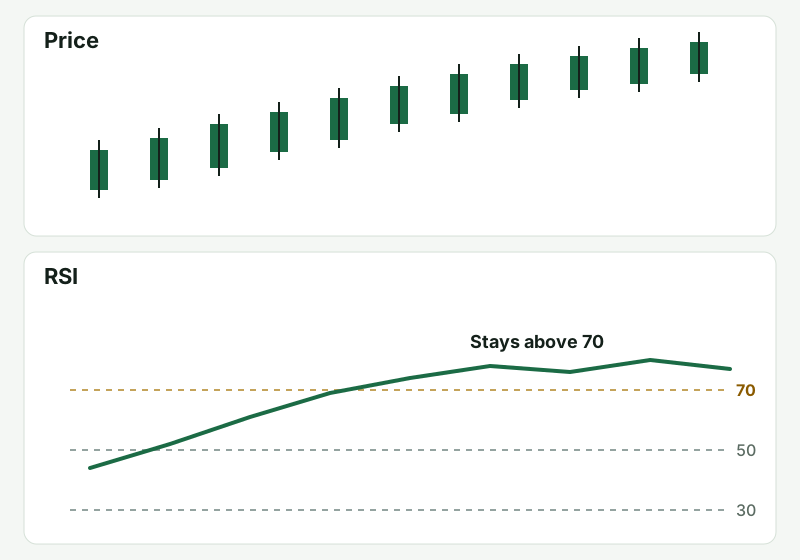
In a strong uptrend, RSI can push through 70 and stay there while price keeps making higher highs. In a strong downtrend, it can live under 30 while price keeps making lower lows. The band says the recent closes have been one-sided. Whether that is a place to wait, or a place to look for a pullback, depends on the level, the volume, and the rules you already use. Some traders move the lines to 80 and 20 on faster charts. A 75 on one setting is a different event from a 75 on another.
How traders read it
The 50 line is the simpler trend filter. When RSI holds above 50 on pullbacks, recent gains are still larger than recent losses. When it drops through 50 and stays there, that balance has flipped. A stock can be above VWAP and above a rising EMA while RSI is above 50. When those readings disagree, you have two views of the same price. Check the level in front of you before you pick a side.
Traders also draw trendlines on RSI itself. Connect two or more RSI highs in a rising market, or two or more RSI lows in a falling market, the same way you would on price. A break of that RSI line can show the momentum swings failing while price is still holding its own structure. Watch what price does at the next level. The break of the oscillator line is the warning. The price reaction is the evidence.
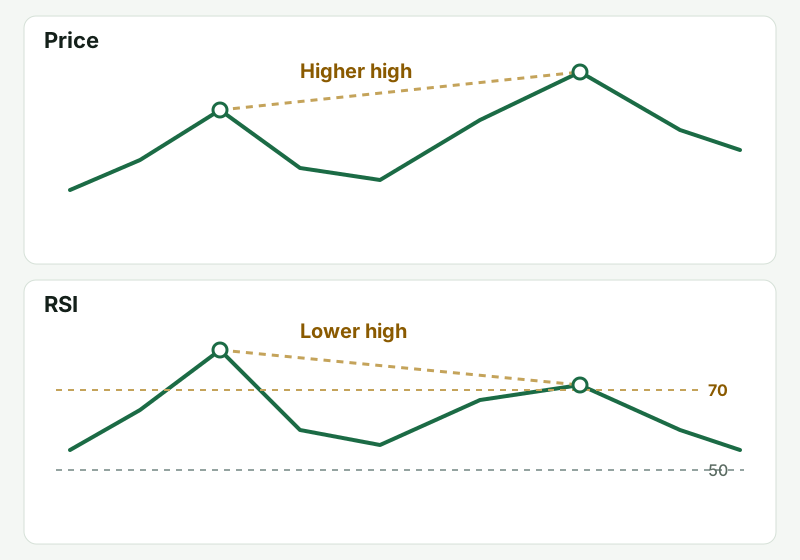
Divergence compares swings. In an uptrend, mark highs on price and highs on RSI. If price prints a higher high and RSI prints a lower high, the new price high arrived with a weaker gain-versus-loss reading. In a downtrend, a lower low in price with a higher low in RSI is the mirror image. The MACD Indicator page shows the same kind of disagreement on a different oscillator. A strong trend can diverge and keep going.
Because both tools are built from price, an RSI extreme and a MACD cross can show up on the same move. That is one price series smoothed two ways. It adds something when price and volume already agree with the direction you are considering.
A reading that stays high
Picture a stock that has been trending up and holding a rising moving average. RSI climbs through 50, tags 70, and then sits between 70 and 80 for several pushes. Each new high in price keeps RSI elevated. Selling only because the number is above 70 means selling a trend that is still producing larger gains than losses. A pullback that brings RSI back toward 50, while price holds the average or a breakout level, is a different picture: the stretch cooled, and the trend structure is still there. The indicator describes that cooling. Your rules for the level, the stop, and the size decide whether it is a trade.
The range is the other picture. Price chops sideways, and RSI travels from near 30 to near 70 and back. Tags of the bands come often, and many of them are just the edge of the range. In that environment the bands stay busy. In a trend they can go quiet because RSI parks on one side of 50.
What usually goes wrong
The usual mistake is buying because RSI is under 30, or selling because it is over 70. Those readings arrive after the closes that created them. On a one-minute chart they flip often. The timeframe you already use for the setup usually produces a cleaner line.
A second mistake is ignoring location. RSI does not know where price is. A reading of 75 above VWAP in a trend is a different situation from a reading of 75 into a resistance level on falling volume. Pair the number with VWAP, a moving average, or a level you can point to.
This page stops at the indicator. Named playbooks keep entries, stops, and targets in Premium. Adding RSI to a playbook that leaves it off the chart, so the chart feels more certain, is how the oscillator gets in the way.
How this fits the rest of the site
Read RSI next to tools that mark location. The EMA Trading Indicator explains the averages a pullback can hold. Support and resistance and trendlines mark where price has reacted. Bollinger Bands describe volatility. RSI describes whether recent closes have been mostly gains or mostly losses.
For the session around the open, start with Creating a Watchlist and the public opening range overview. Those pages separate a process from a number on an oscillator.
Where to go next
Read the MACD Indicator for the other common momentum oscillator, built from moving averages instead of a 0 to 100 scale. Entry, stop, and target rules for Green Horizon strategies stay in Premium.
Key Takeaways
- RSI compares average gains with average losses on a 0 to 100 scale
- The usual setting is 14 periods, and 50 is the midpoint
- 70 and 30 describe a stretched reading, and RSI can stay there in a trend
- Holding above 50 means recent gains are still larger than recent losses
- An RSI trendline break and a divergence are disagreements to watch at the next price level
- The indicator lags, ignores volume, and ignores where price is
- Strategy entries, stops, and targets stay in Premium
Pro Tips
- Leave the 14-period setting alone until you can explain a 70 reading on the default chart.
- In an uptrend, see whether pullbacks hold above 50 before you call 70 a reversal.
- Draw RSI trendlines only when two swings are obvious.
- A divergence on RSI and a divergence on MACD are still one price series.
- On a one-minute chart, RSI crosses 30 and 70 too often to be a plan.
- If the line is stuck between 40 and 60, the gain-and-loss balance is quiet. Treat that as a range.