

What MACD is
Moving average convergence divergence, or MACD, is a momentum indicator made from exponential moving averages. Gerald Appel popularized the standard form in the late 1970s. Most platforms still load the same defaults: a 12-period EMA, a 26-period EMA, and a 9-period signal line. Those numbers are a convention, not a Green Horizon rule. If you change them, you are looking at a different indicator, so compare charts only when the settings match.
MACD does not use volume. It measures how far a faster average has moved away from a slower one. When the two averages sit on top of each other, momentum is quiet and the lines are converging. When the faster average pulls away, momentum is expanding and the lines are diverging. That spread is the whole indicator.
The three parts
Three numbers are plotted, and the second two are derived from the first.
MACD line = 12-period EMA − 26-period EMA. Signal line = 9-period EMA of the MACD line. Histogram = MACD line − signal line.
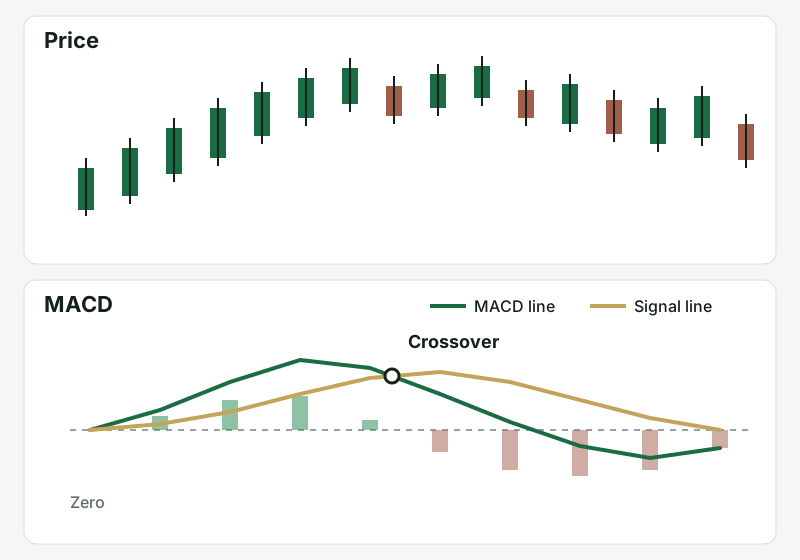
The MACD line leads. The signal line is a moving average of that line, so it lags. Zero is the point where the 12-period and 26-period EMAs are equal. Above zero, the faster average is above the slower one. Below zero, it is underneath.
The histogram is the gap between the MACD line and the signal line, drawn as bars. Bars grow when the MACD line is pulling away from the signal line. Bars shrink when the signal line is catching up. Taller bars above zero mean upside momentum is expanding. Taller bars below zero mean downside momentum is expanding. Shrinking bars mean that separation is fading. Fading momentum can be a pause inside a trend or the start of a turn. Price has to show you which.
In a range, the two EMAs stay close, so MACD often oscillates in a tight band around zero. In a trend, it can stay positive or negative for a long time because the averages are already separated. Check the scale on your own platform before you compare a number with someone else’s screenshot. The same calculation can be labeled 2 on one chart and 0.2 on another. Read the shape and the position relative to zero.
How traders read it
A crossover is the MACD line passing through the signal line. A cross up says the faster measure has turned up relative to its own average. A cross down says it has turned down. In a trend that is already visible on price, that cross can line up with the next push. In a choppy range, the same cross can print over and over while price goes nowhere. The cross describes a change in the gap. Price, volume, and the rules you already use still decide whether you act.
Distance from zero describes how far the averages have separated. A cross that happens while MACD is already far above zero is happening after the faster EMA has been well above the slower one. The averages are stretched. That can be a mature trend, or a move that is closer to snapping back toward balance, depending on price. A cross deep below zero is the mirror image.
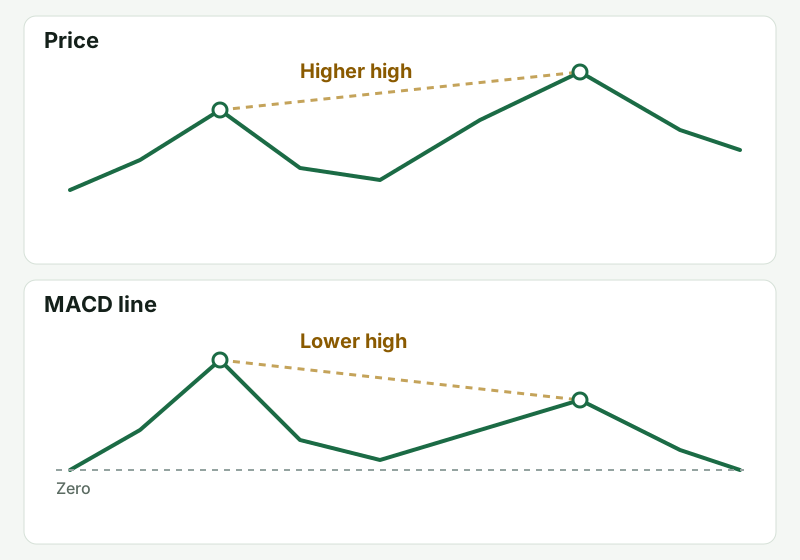
Divergence compares swings. In an uptrend, mark highs on price and highs on the MACD line. If price prints a higher high and the MACD line prints a lower high, momentum did not confirm the new price high. In a downtrend, mark lows. If price prints a lower low and MACD prints a higher low, downside momentum is weakening. A strong trend can keep going after it diverges. Treat that disagreement as a reason to watch the next cross and the level in front of price.
Because the line is a pair of EMAs, it helps to know those averages on their own. The EMA Trading Indicator explains why a shorter average bends sooner than a longer one. MACD is that relationship, moved off the price panel and drawn around zero.
A trend pause and a range
Picture a stock that has been trending up and then pulls back for several candles. During the push, the MACD line is above the signal line, and the histogram bars above zero are growing. On the pullback, the bars shrink as the signal line catches up, but the MACD line stays above zero and price holds a rising EMA or a level it just broke. If the MACD line turns up again and the bars start to grow, momentum is re-expanding in the direction of the trend. That is a reading of the indicator. Whether it becomes a trade depends on the level, the stop, and the size in the rules you already use.
The other picture is a stock chopping sideways. The 12- and 26-period EMAs overlap, MACD hugs zero, and the line crosses the signal every few candles. Each cross looks like a new trend on the oscillator and looks like noise on price. That is the environment where this indicator is least useful. Waiting is a valid use of the tool.
What usually goes wrong
The usual mistake is treating every crossover as an entry. MACD is calculated from prices that have already printed, so the cross arrives after the move that created it. On a one-minute chart the lag is still there, and the noise is worse. The timeframe you already use for the setup usually produces fewer crosses.
A second mistake is reading shrinking histogram bars as a completed reversal. Contraction means the two lines are getting closer. In a trend, that often happens on a pause, and then the bars expand again in the same direction. Look at whether price has lost the structure you were using — a trendline, a support or resistance area, VWAP, or the moving average on the chart — before you decide the pause is over.
A third mistake is stacking MACD with more oscillators that all come from the same price series. They can disagree because they smooth price differently, not because the market is sending several independent messages. If MACD is on the chart, it should answer one question: is the spread between the fast and slow average expanding or contracting? Price and volume still have to carry the decision.
This page stops at the indicator. Named playbooks keep entries, stops, and targets in Premium. If a playbook leaves MACD off the chart, adding the oscillator so the chart feels more certain is how it gets in the way.
How this fits the rest of the site
Use MACD beside a tool that marks where price is. VWAP is the intraday average weighted by volume. MACD is built from price alone. Support and resistance and trendlines mark where price has actually reacted. Bollinger Bands describe volatility expansion and contraction. A momentum reading can sit beside a band tag or a squeeze. It still lags, and a tight band with price going nowhere is still a skip.
For the process around a trading day, start with Creating a Watchlist and the public opening range overview. Those pages separate structure from a signal. The opening range article is also the pattern this site uses when a concept is public and the rule set is not.
Where to go next
Read the EMA Trading Indicator for the averages inside the calculation, and the VWAP Trading Indicator for the benchmark MACD does not measure. Entry, stop, and target rules for Green Horizon strategies stay in Premium.
Key Takeaways
- MACD is the 12-period EMA minus the 26-period EMA, smoothed with a 9-period signal line
- The histogram is the gap between the MACD line and the signal line
- Growing bars mean that gap is expanding; shrinking bars mean it is fading
- A crossover is a change in that gap, and the trade decision still sits with your rules
- Divergence is a disagreement between price swings and MACD swings, and it can persist
- The indicator lags, ignores volume, and chops when the two EMAs are flat
- Strategy entries, stops, and targets stay in Premium
Pro Tips
- Leave 12, 26, and 9 alone until you can explain a cross on the default chart.
- Compare position relative to zero, not a raw number copied from another platform’s scale.
- Shrinking bars in a trend are often a pause. Check price structure before you call it a reversal.
- Crosses on a one-minute chart arrive late and often reverse.
- If MACD and another oscillator disagree, you added a second smoothing of the same price. Drop one.
- A flat MACD stuck near zero is a range. Treat that as a reason to wait.