Double & Triple Tops and Bottoms
Recognizing Major Reversal Patterns
Reversal patterns help traders spot when a trend may be nearing exhaustion and preparing to change direction.
Two of the most reliable and widely used reversal formations are Double Tops/Bottoms and Triple Tops/Bottoms.
These patterns appear across all timeframes—1-minute scalps, intraday charts, swing trades, and even long-term investing.
Their strength comes from repeated failed attempts to break a key level, which signals a potential shift in market sentiment.
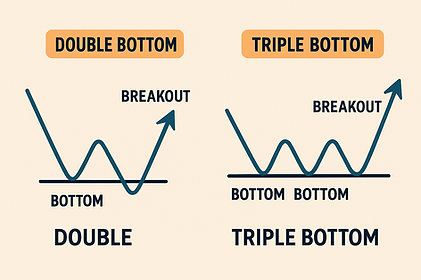
Double Bottom Pattern (Bullish Reversal)
A double bottom is shaped like the letter W.
It forms when a stock makes:
-
A strong drop into a new low
-
A bounce into resistance
-
A retest of the same low
-
A breakout above the bounce high
This pattern signals that sellers failed twice to break the support
level, and buyers are stepping in aggressively.
Key Characteristics
-
Two distinct lows at roughly the same price
-
A middle peak between the lows
-
Support holding firmly on the second test
-
Breakout confirmed when price exceeds the middle peak
Why It Works
The second bounce often attracts heavy buying because traders view it as a confirmation that the low is being defended.
The steeper and more aggressive the second drop, the stronger the rebound tends to be.
Triple Bottom Pattern (Stronger Bullish Reversal)
A triple bottom is similar to a double bottom but includes three tests of the same support level.
This pattern represents a more powerful reversal because:
-
Sellers failed three separate times to break support
-
Each retest traps more short sellers below the level
-
Breakout often leads to a sharp uptrend due to momentum + short covering
Structure
-
First bounce off support
-
Second bounce retests the support
-
Third bounce confirms buyer strength
-
Breakout above previous peaks begins a trend reversal
Triple bottoms produce some of the best reversal moves because they show persistent accumulation.
Double Top Pattern (Bearish Reversal)
A double top is shaped like an M and signals that buyers
are losing strength.
The pattern forms when:
-
Price pushes to a high
-
Pulls back
-
Retests the same high
-
Fails and breaks below the pullback valley
Key Characteristics
-
Two peaks at nearly the same level
-
Buying pressure weakens on the second test
-
Breakdown confirms the new bearish trend
Psychology Behind the Pattern
When buyers cannot break a high twice, confidence falls.
Sellers step in, longs exit positions, and the breakdown accelerates.
Triple Top Pattern (Stronger Bearish Reversal)
A triple top adds a third failed breakout attempt, making it a more powerful bearish signal.
Why It’s Stronger
-
Buyers fail three times at the same resistance
-
Each failure traps more longs at the top
-
Breakdown triggers both long exits and short entries
-
Often leads to a deeper, more aggressive decline
Structure
-
First peak → rejection
-
Second peak → rejection
-
Third peak → final rejection
-
Break below the valleys → trend reversal
Triple tops often form at the end of strong uptrends and signal exhaustion.
Pattern Reliability & Tips
To increase success with these patterns:
✔ Look for clear, distinct peaks or troughs
✔ Combine with volume:
High volume on breakout = strong confirmation
✔ Patterns on higher timeframes carry more weight
✔ Avoid patterns that look “too tight”—you want clean symmetry
✔ Use support/resistance levels for stop placement
These patterns become extremely powerful when combined with EMAs, VWAP, trendlines, and momentum indicators.
Key Takeaways
-
Double bottoms/tops = 2 tests of support or resistance
-
Triple bottoms/tops = 3 tests → stronger reversal signal
-
W-shaped = bullish reversal
-
M-shaped = bearish reversal
-
Confirmation comes from the break of the middle structure
-
More tests = stronger breakout or breakdown
Pro Tips - Double & Triple Tops
-
A Double Top becomes significantly stronger when the second top forms on lower volume.
-
Triple Tops often signal trend exhaustion — momentum usually weakens before the breakdown.
-
The best Double/Triple Top breakdowns happen when price rejects the neckline on a retest.
-
Look for confirmation from indicators like EMA9/EMA20 — if both are curling down, the reversal is stronger.
-
A wick into the resistance zone (fake breakout) often leads to a sharper, cleaner breakdown.
-
Identify whether the tops form under a major daily/weekly resistance level — those breakdowns have the highest follow-through.
Pro Tips - Double & Triple Bottoms
-
A Double Bottom is strongest when the second bottom forms on higher buying volume.
-
Triple Bottoms often indicate accumulation — watch for higher lows on micro-timeframes.
-
The safest confirmation is when price breaks above the neckline and retests it as support.
-
If the second bottom forms with a long lower wick, it shows strong buyer absorption.
-
Combine Double/Triple Bottoms with VWAP reclaim or EMA20 reclaim for powerful long entries.
-
Check for the pattern forming at a major higher-timeframe support level — these produce explosive reversals.
